– Text element
A reference page for the Seating Charts editor, covering one of the building blocks you use to construct your venue layout. Combined with the other building blocks (seating groups, standing areas, tables, decorative elements, text, background images), this is what lets you draw any venue as a fully interactive, click-to-buy seating chart.
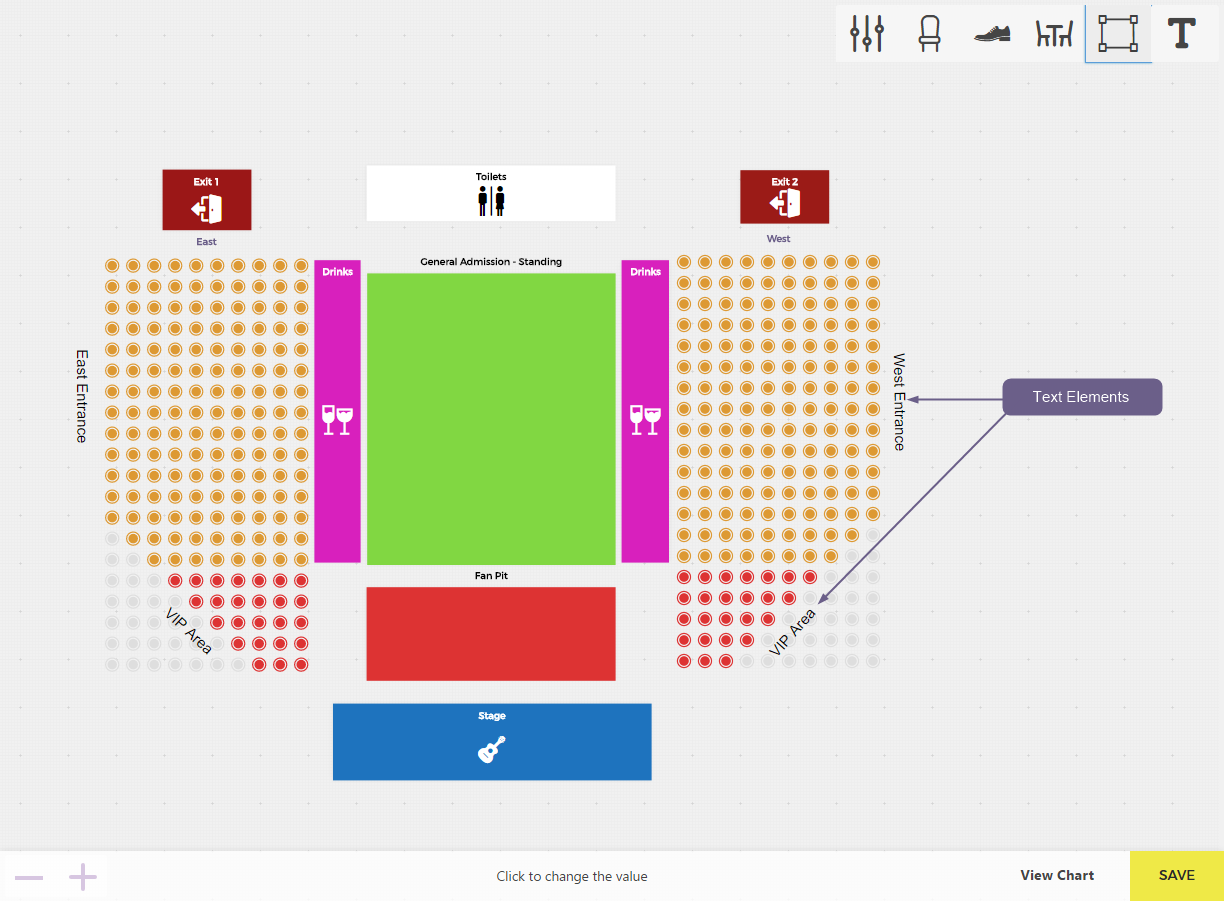
When your seating chart layout is visually complete, you’ll likely want to add some labels — section names, directions, or titles like Main Stage, VIP Area, or Balcony Section. That’s where the Text element tool comes in.
Text elements don’t affect tickets or functionality. Their purpose is purely visual — helping you name and describe parts of your venue directly on the chart.
Adding a text element
Click the “T” icon in the toolbox to open the Text element pane.
Type in the text you want to display (for example, “Main Entrance” or “Balcony A”) select the color and font size and then click Create.

Your text will immediately appear on the canvas.
Editing, styling, and positioning
After adding a text element, you can use all standard control icons to modify it:
- Move it anywhere on the canvas by dragging.
- Rotate it by using the rotate icon.
- Bring it to front to keep it visible over other objects.
Pro tip
Text elements become especially powerful when combined with “invisible” elements (where the icon and background colors match).
Use rectangles to draw walls, zones, or catwalks, then overlay a text element on top to label them.
Because text can be rotated and resized independently, this combo lets you build realistic, visually descriptive maps without needing any custom graphics.
Creative use cases
Organizers often use text elements not only for labeling sections but also for:
- Adding directions (e.g., “To Exit”, “To Restrooms”)
- Marking special areas (like “Press Zone”, “Backstage Access Only”)
- Adding sponsor or brand names directly onto layouts
Together with elements and color customization, text elements turn your chart into a clear, branded, and intuitive map of your event.
Related
Was this article helpful?
Yes — great. No or partially? Tell us what was missing — we read every message and use it to improve these docs.